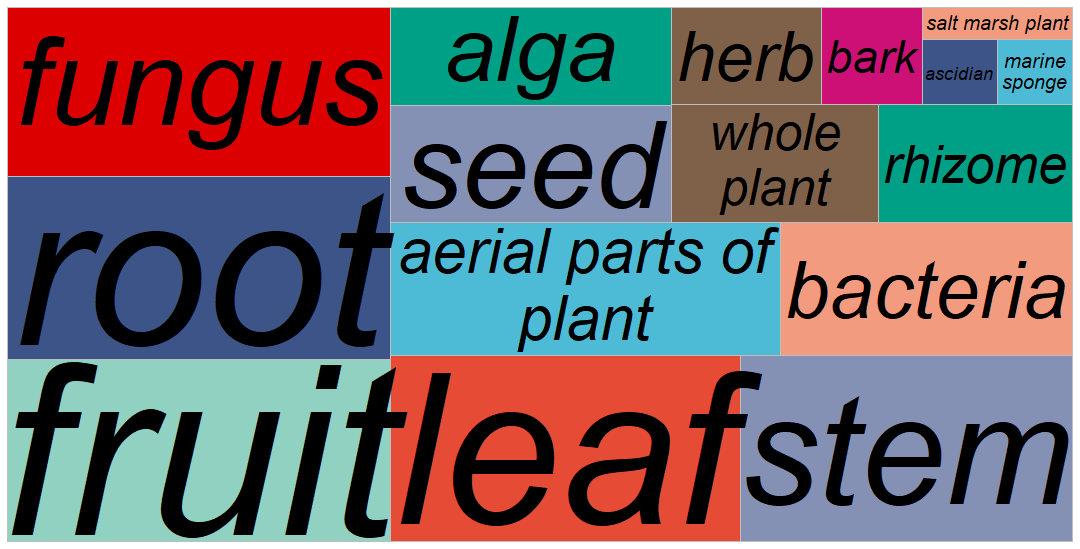
Natural sources of antioxidant compounds
Figure 1.
Analysis of the physicochemical properties of compounds in AntioxidantDB
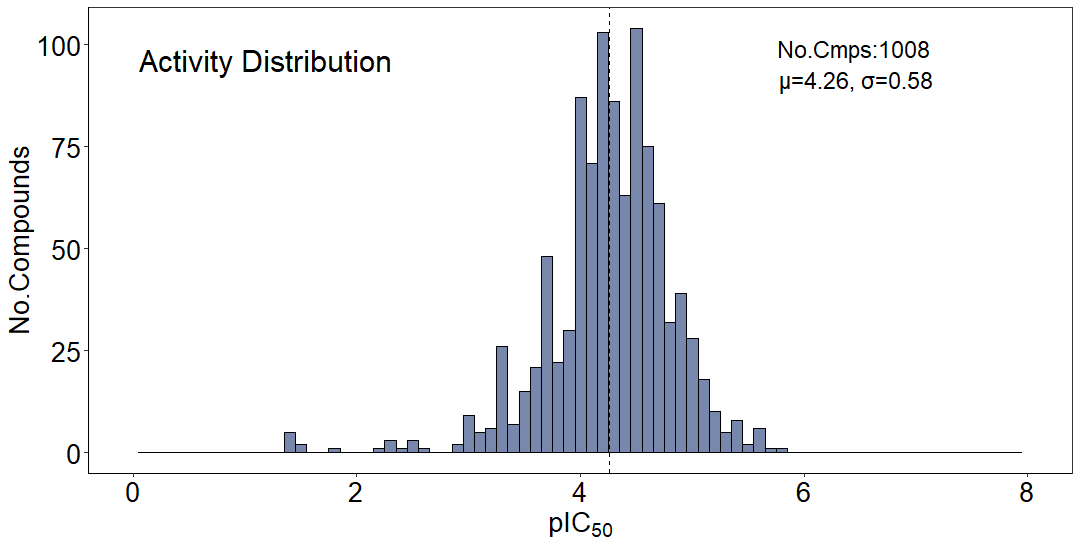
Figure 2.

Histogram for the pIC50 values from compounds in the original dataset
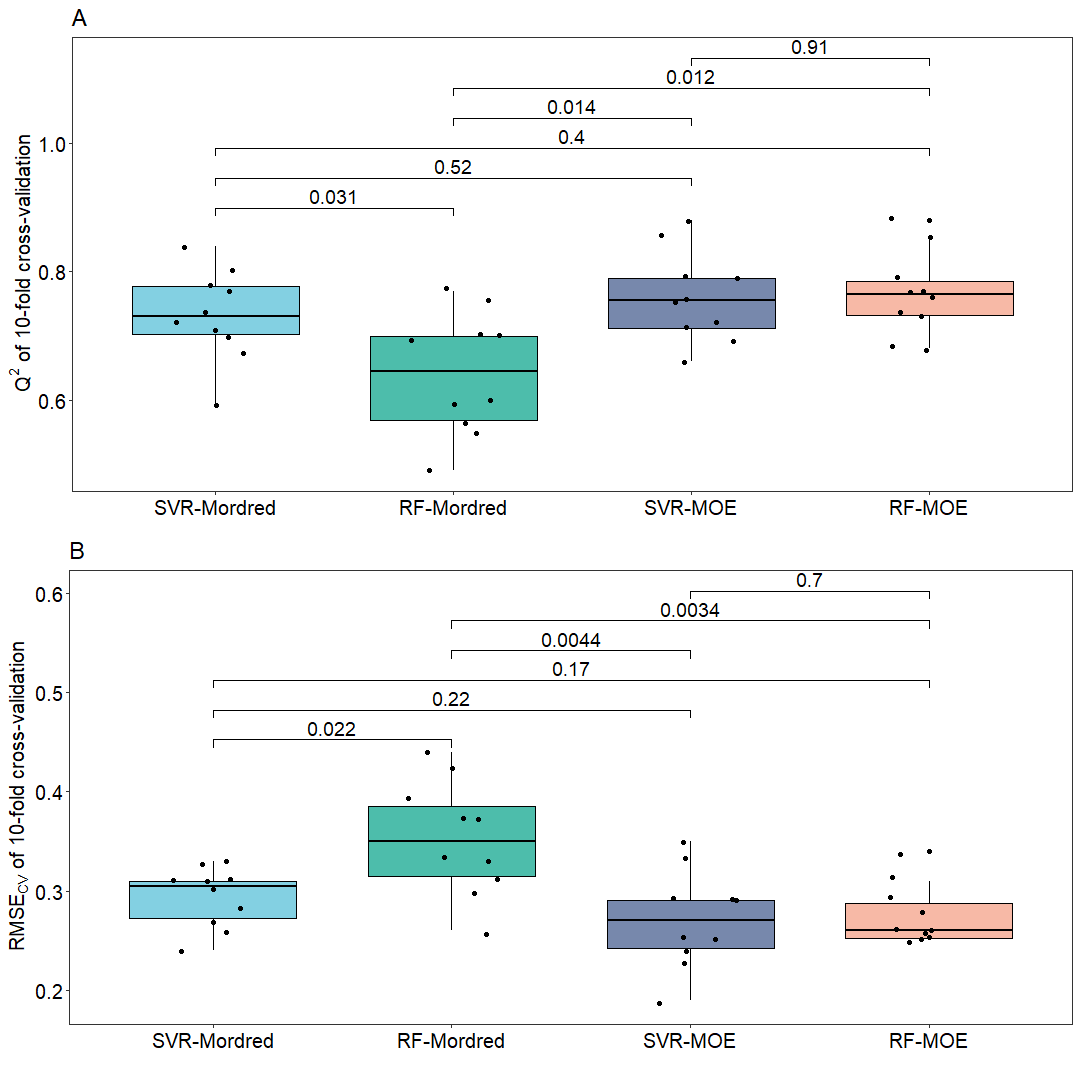
Figure 3.
Comparisons of the Q2 and RMSEcv of four regression models
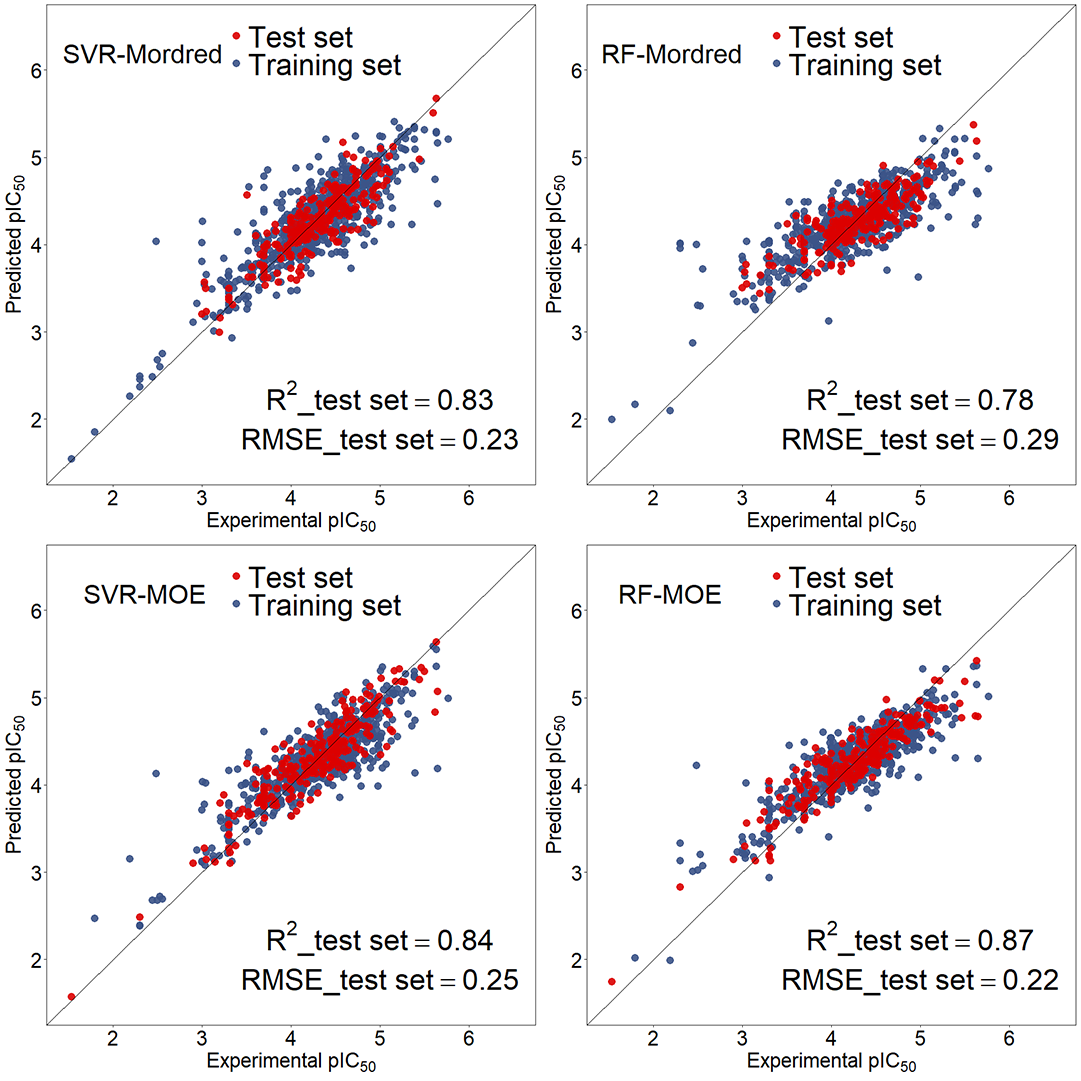
Figure 4.
Scatter plots of experimental versus predicted relative activity values. Blue dots denote the training, while red dots denote the testing set observations
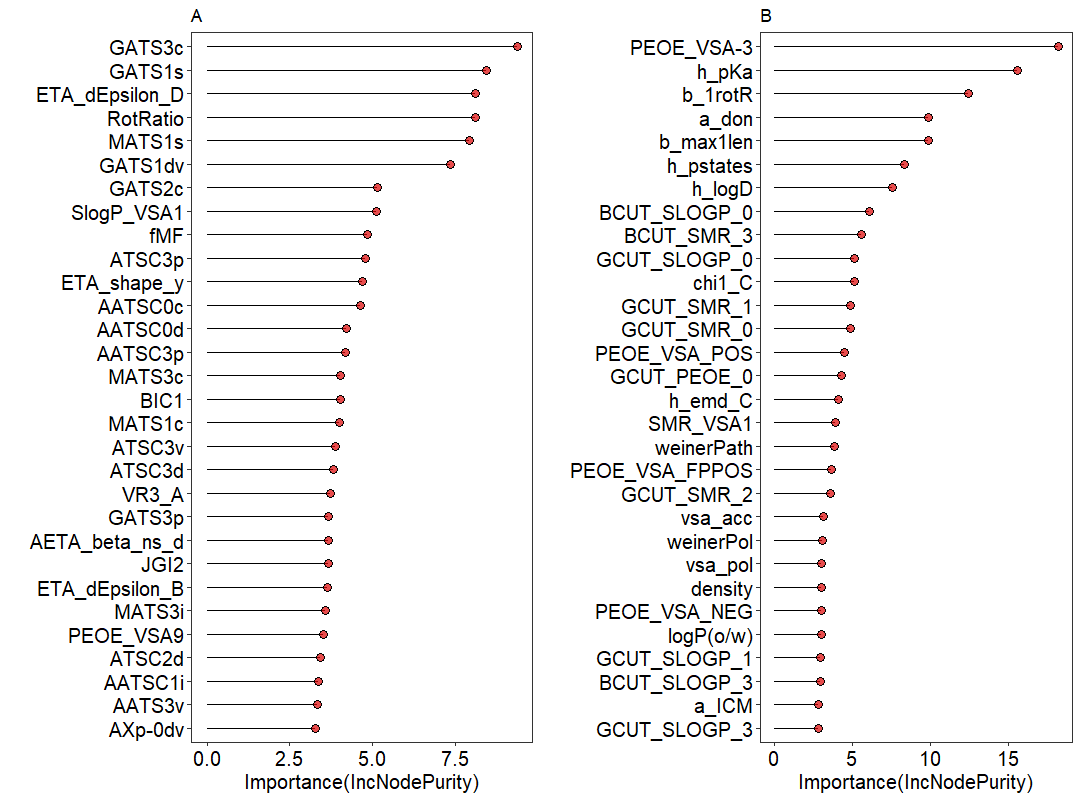
Figure 5.
The importance of descriptors is evaluated by Random Forest models
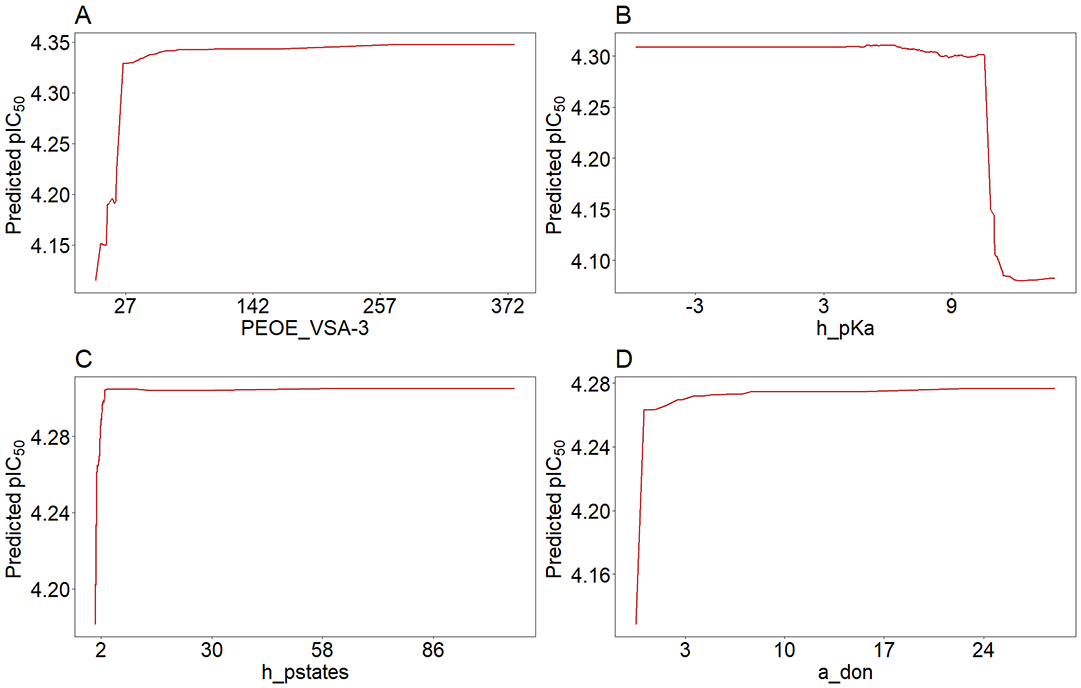
Figure 6.
Partial dependence plots of 4 important MOE descriptors
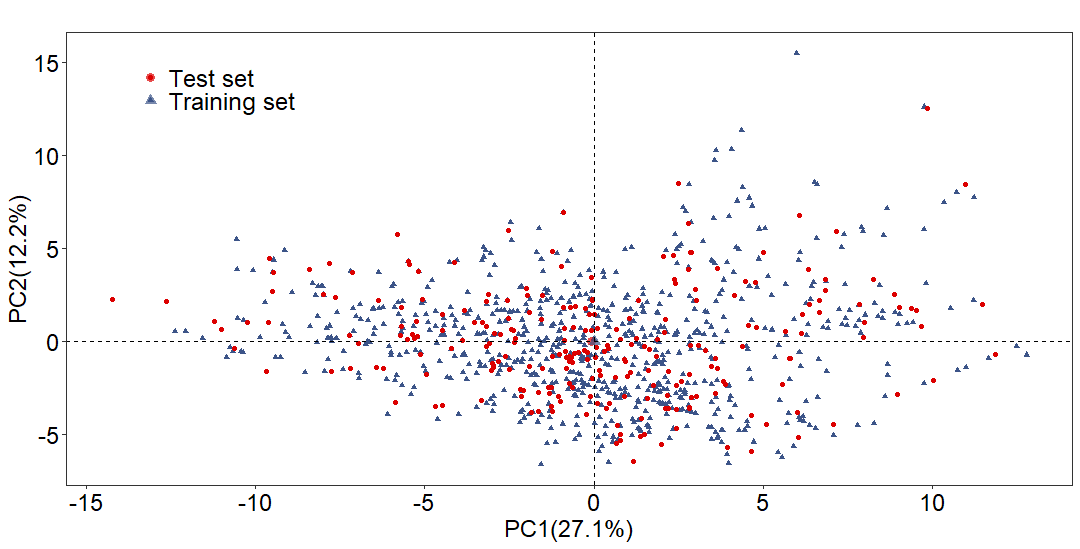
Figure 7.
Chemical space of the training set and test set by a principal component analysis (PCA) using a set of 76 selected Mordred descriptorss
Figure 8.